How it works
Connecting your Zite app to Google Analytics lets you track how users interact with your app, from the pages they visit to the actions they take. This gives you a clear view of engagement, conversions, and user behavior without needing to build your own analytics system.What you can track with Google Analytics
Here are common ways Google Analytics can be used across different types of apps: Traffic & Engagement- Page view tracking - see which pages get the most visits (works for any multi-page app)
- Session duration - understand how long users spend in your app
- Bounce rate - see if visitors leave without interacting
- Traffic sources - know where your users are coming from (direct, search, social, referral)
- Form submissions - track when users complete forms (signups, contact forms, surveys)
- Button/CTA clicks - measure which calls-to-action get the most engagement
- Purchases/checkouts - track revenue and conversion rates for e-commerce apps
- Sign-ups & logins - monitor user acquisition and return visits
- Downloads - track file or document downloads
- Multi-step flows - see where users drop off in wizards, onboarding, or checkout processes
- Search behavior - track what users search for within your app
- Feature adoption - measure which features get used and which get ignored
- Demographics & geography - understand who your users are and where they’re located
- Device & browser data - know if users are on mobile, desktop, or tablet
- New vs returning users - track retention patterns
- Content interactions - clicks on cards, tabs, filters, or categories
- Error tracking - log when users hit errors or dead ends
- Sharing/invites - track viral actions like sharing links or inviting others
How to analyze user activity
1
Connect to Google Analytics
In the chat box, request your app to be integrated with Google Analytics or click the 
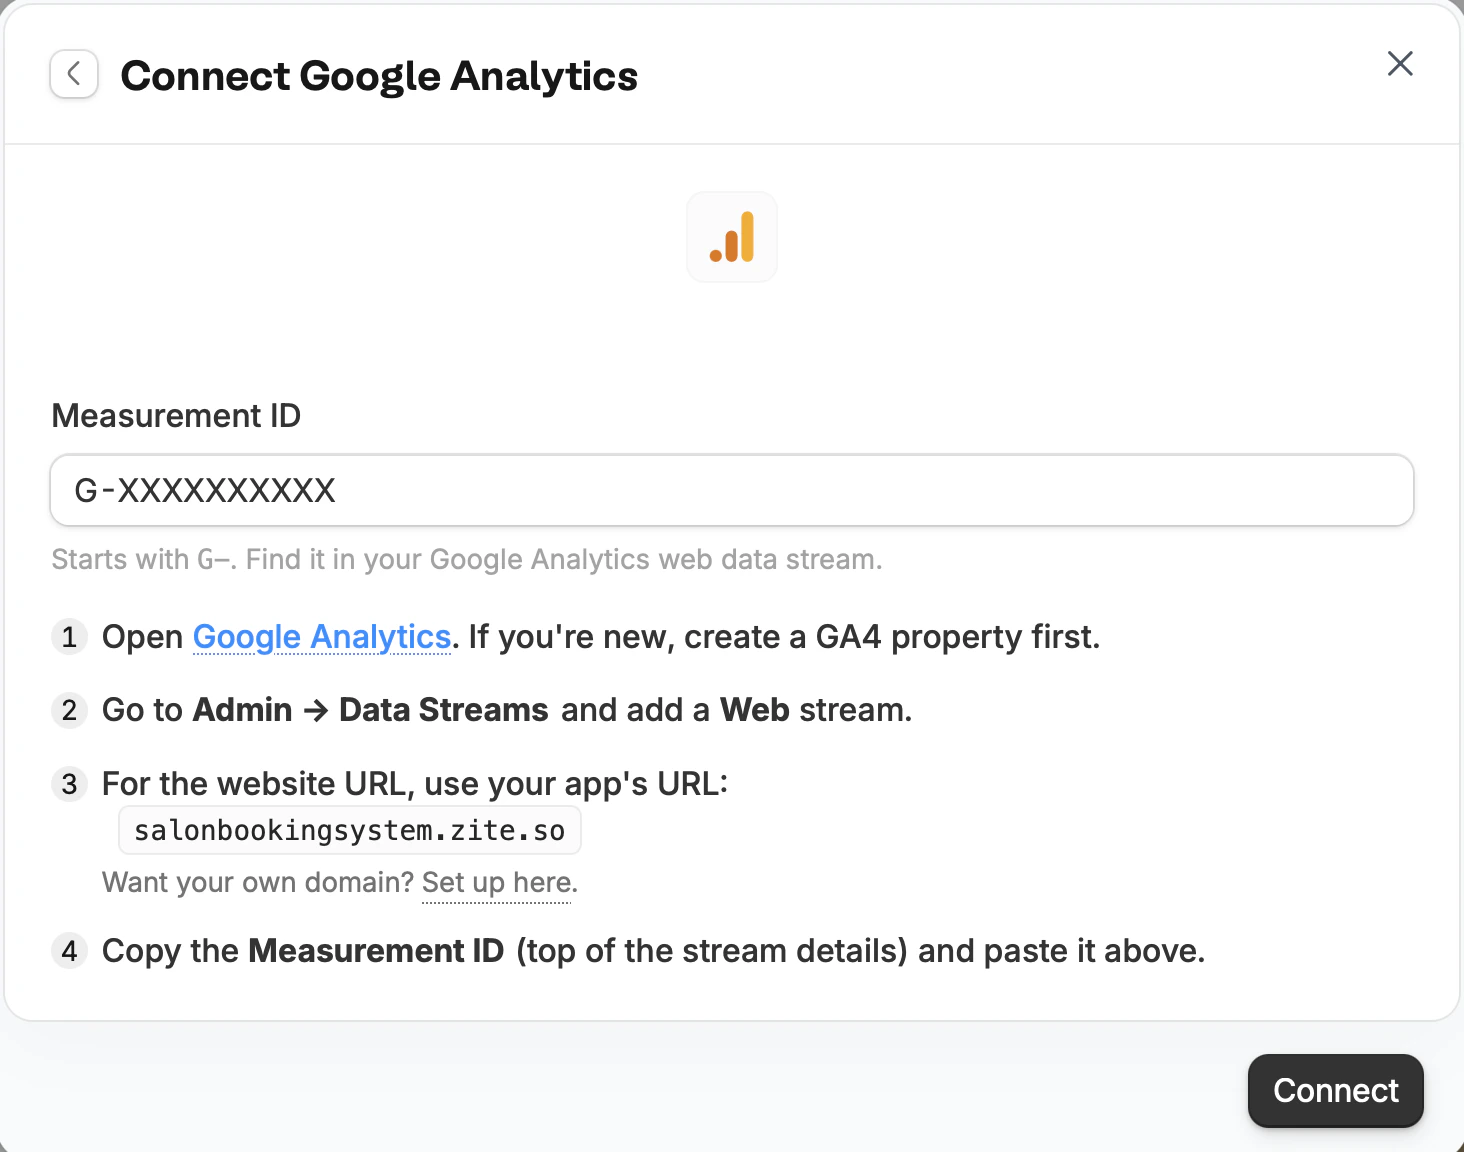
plug icon .2
Enter your use case
Tell Zite how you want to use Google Analytics in your app. In our example, request to track traffic and user preferences.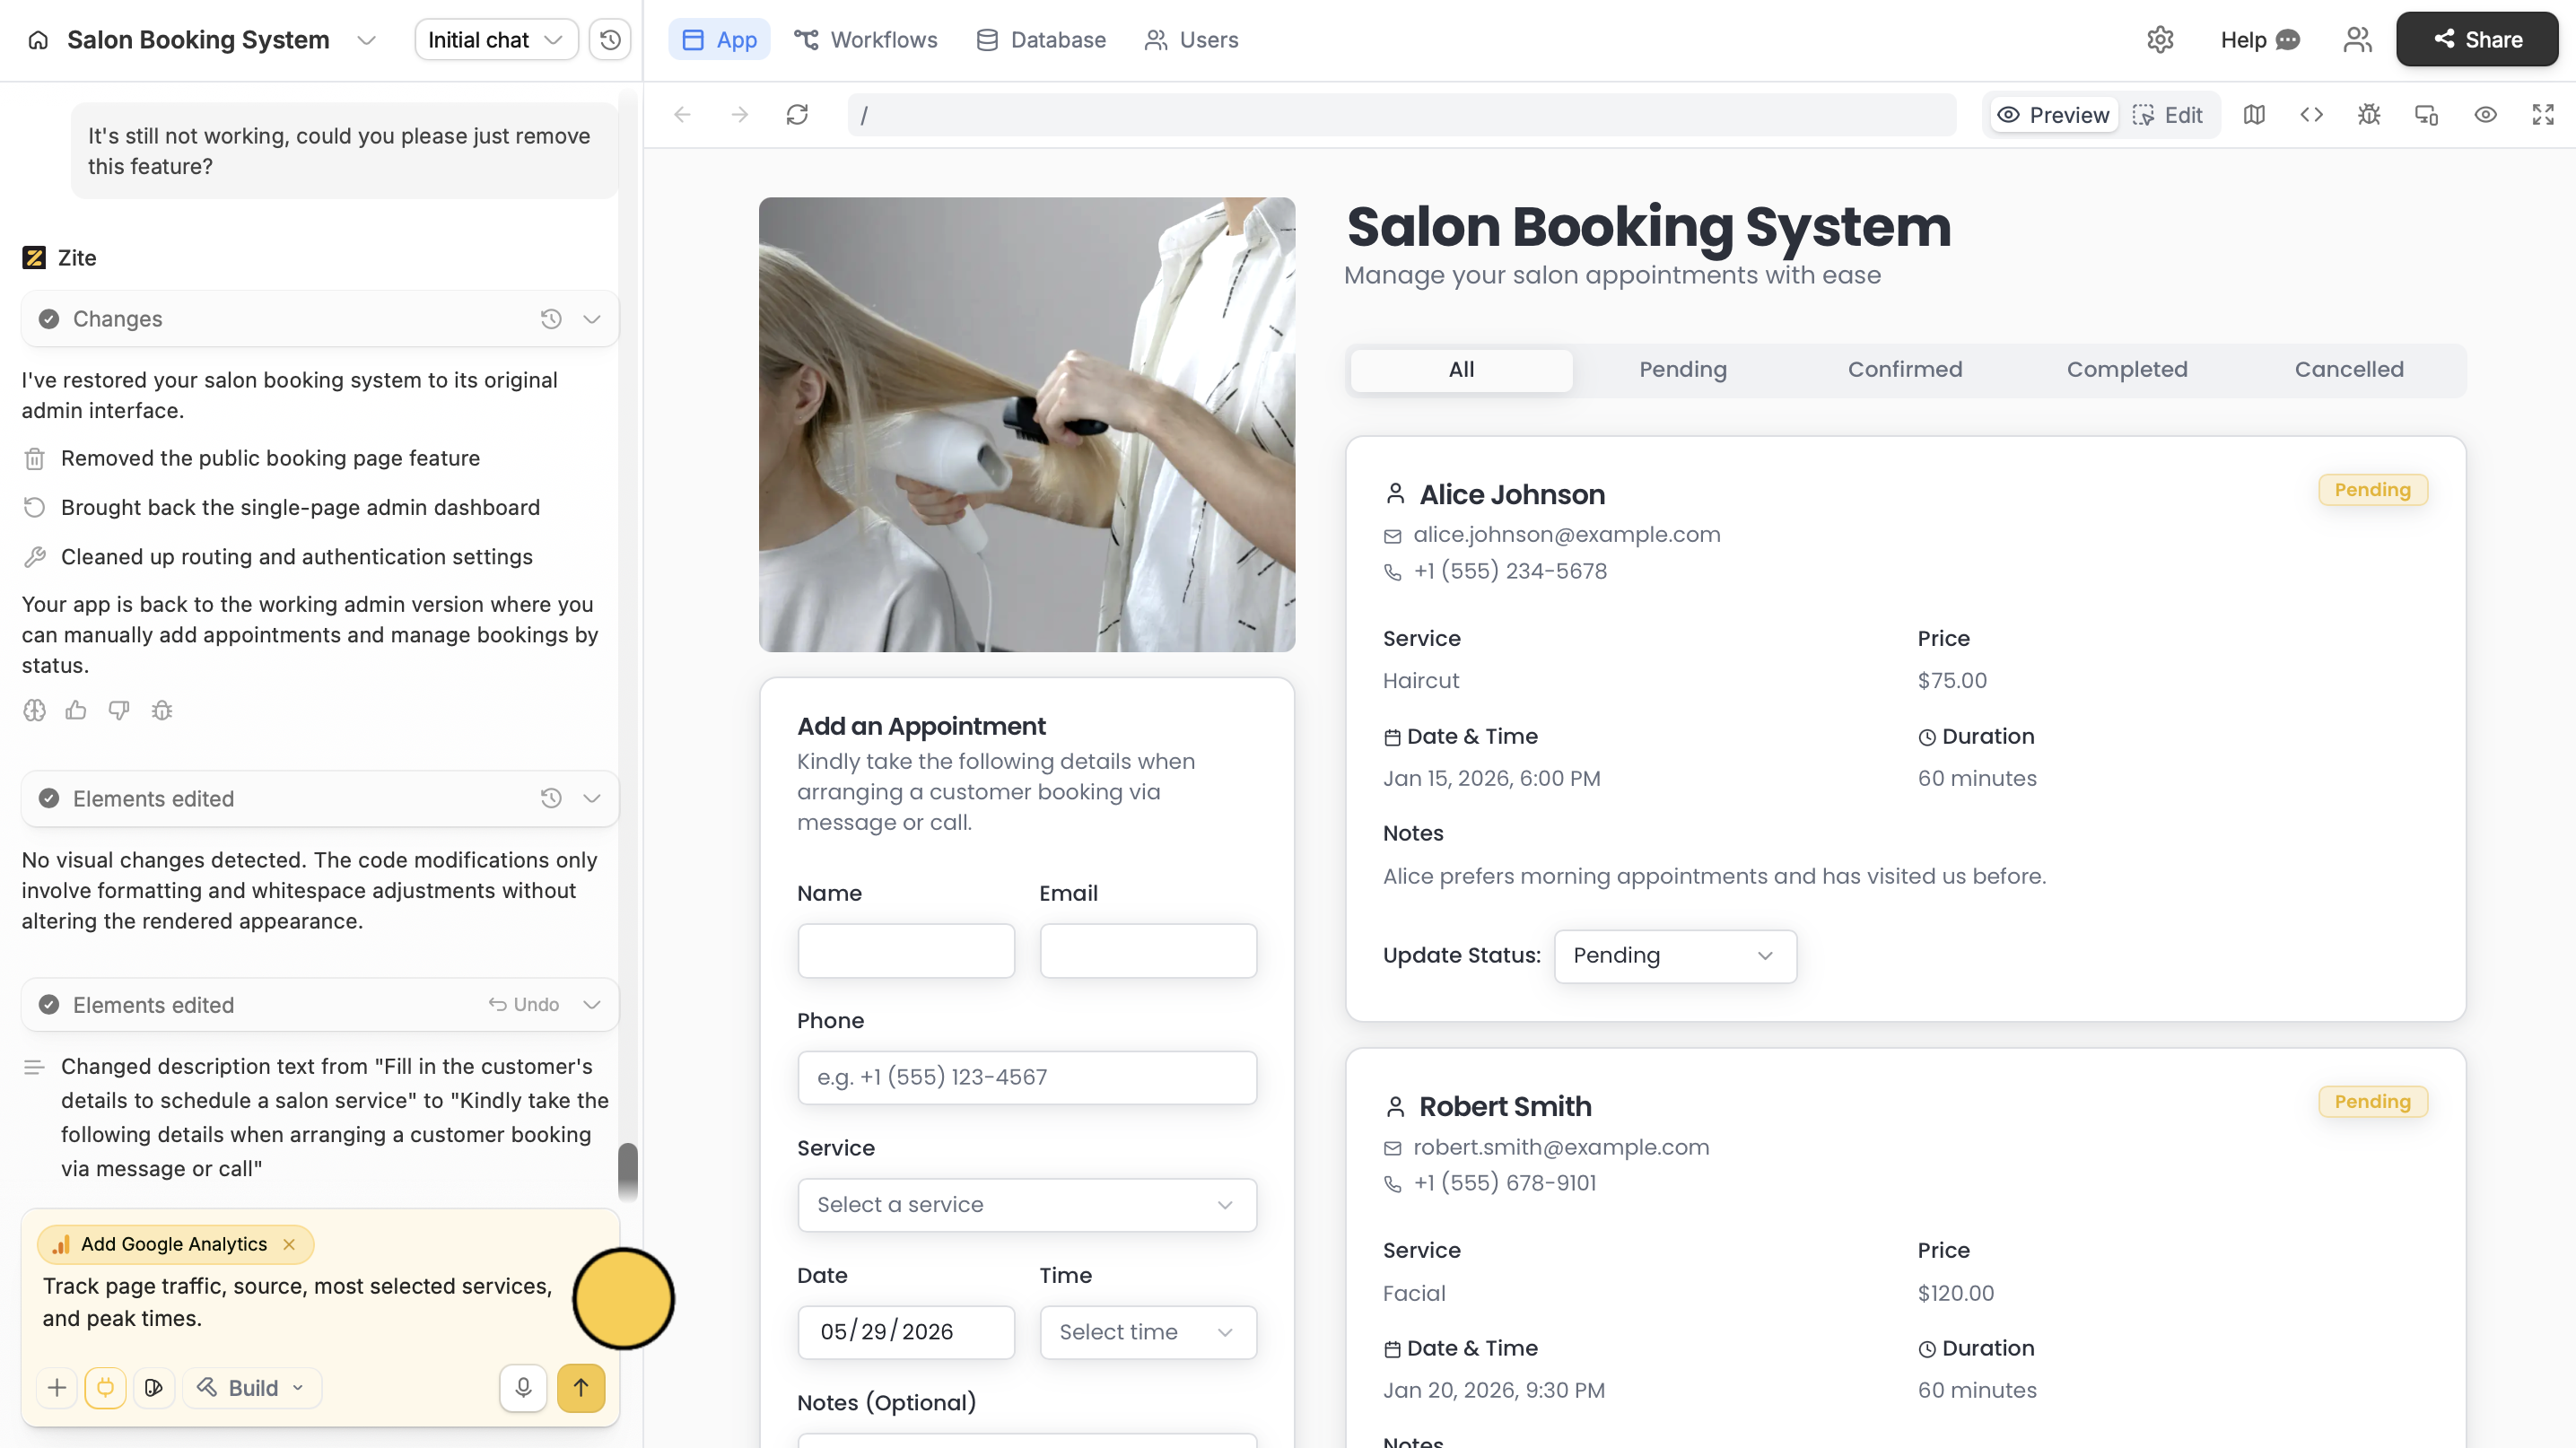
3
Deploy and share
That’s it! The metrics you requested to be track will now show up in your Google Analytics dashboard under Reports → Events.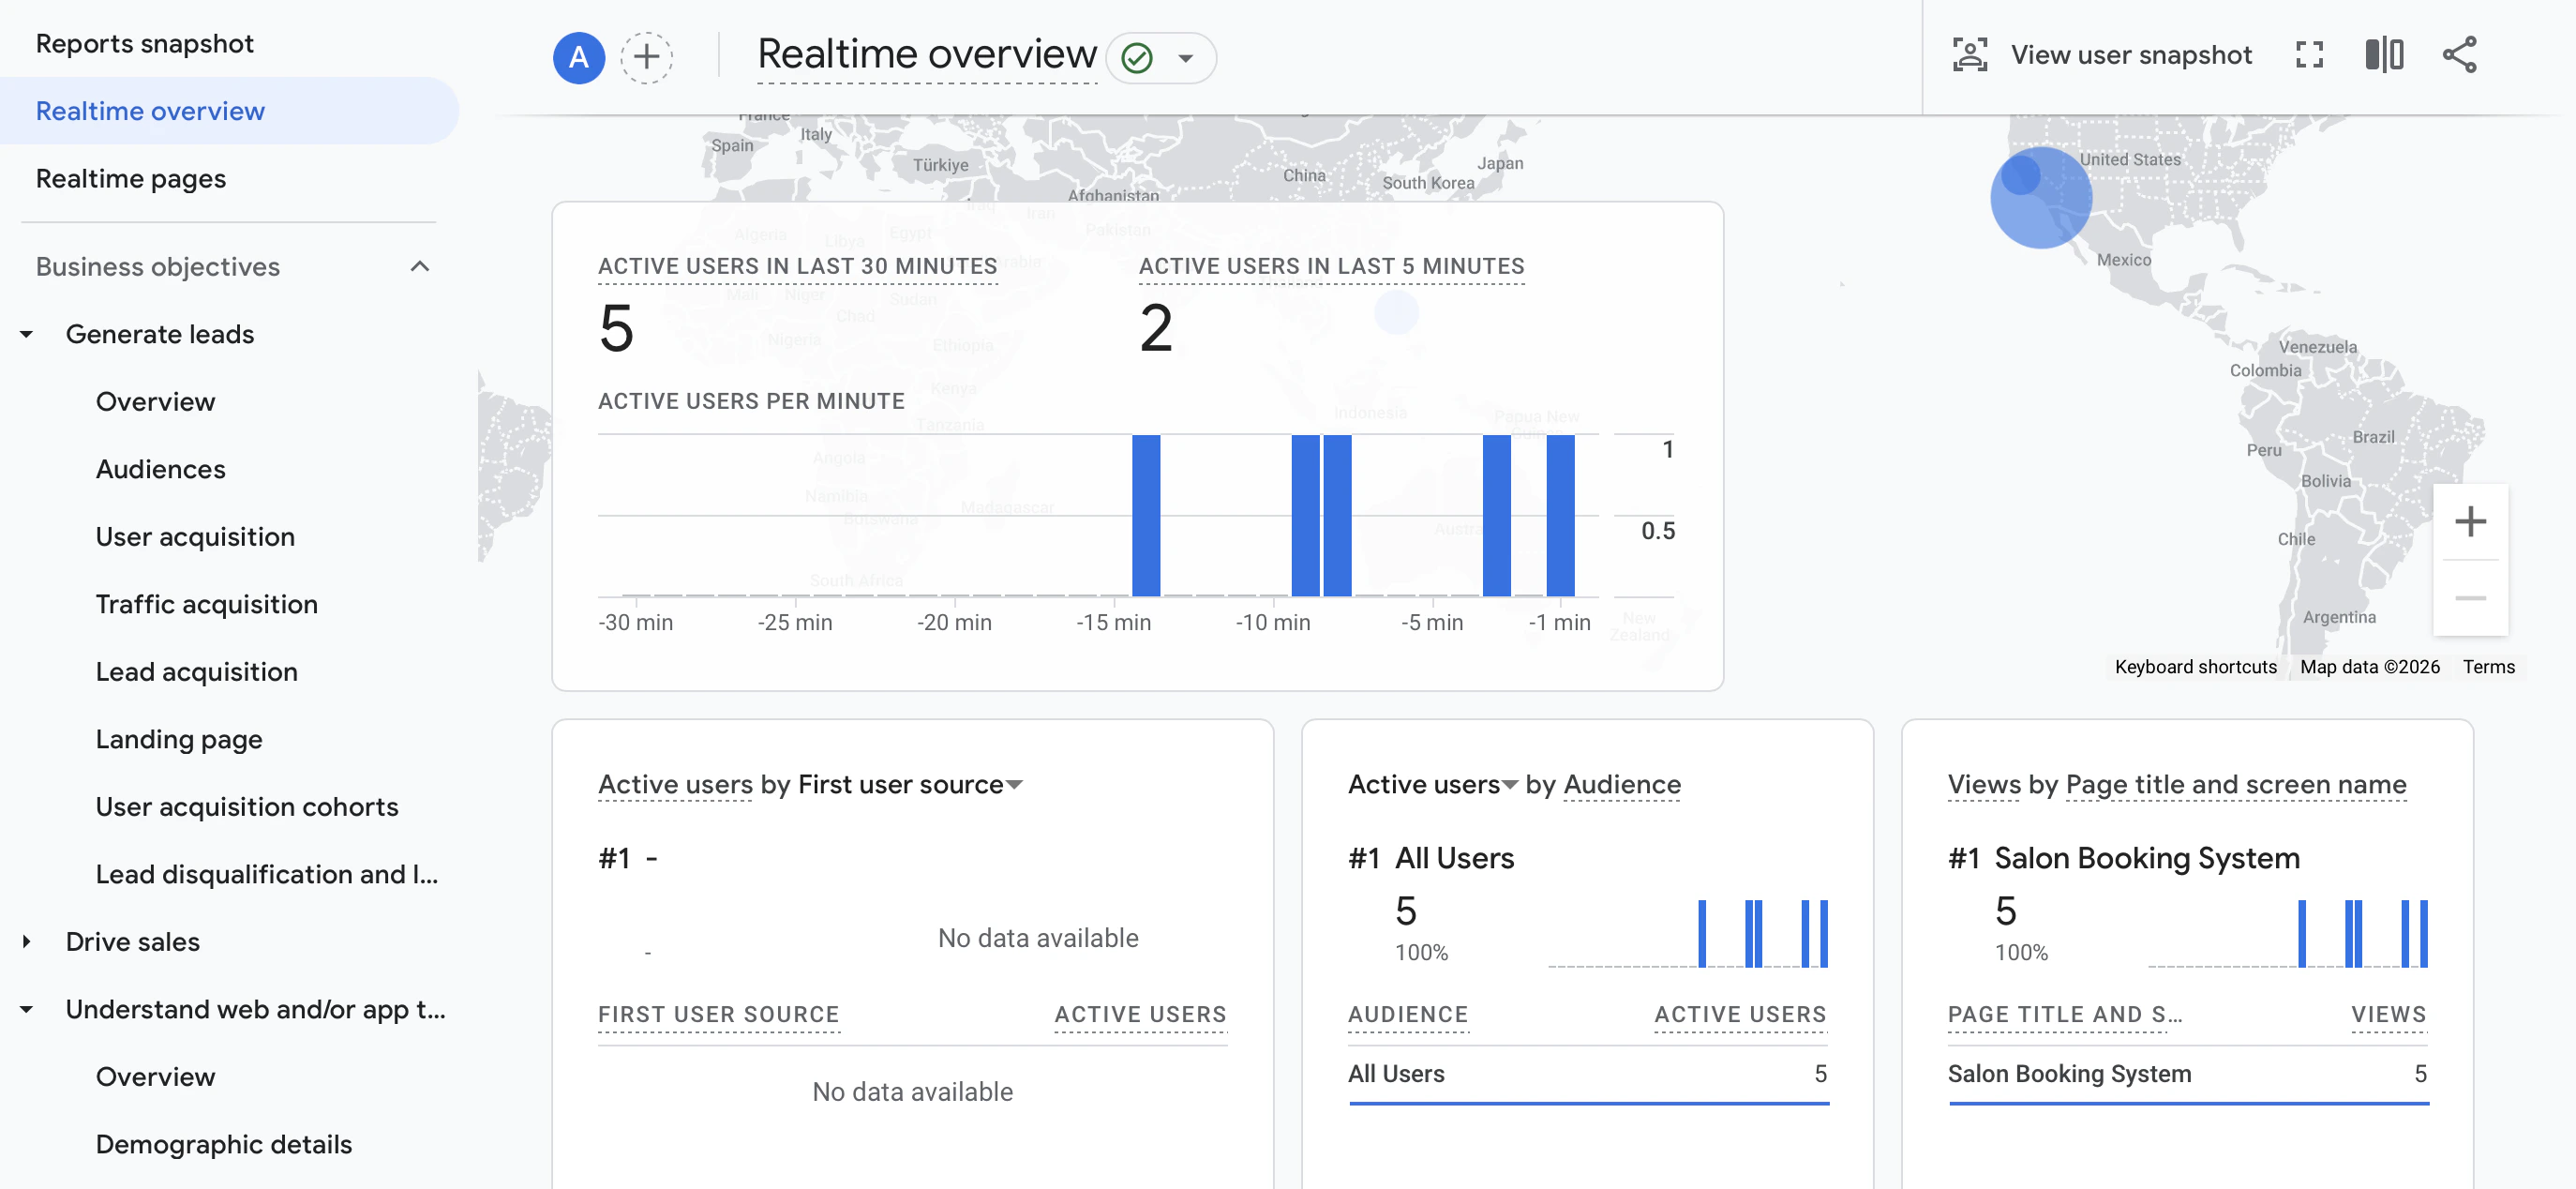
It may take 24–48 hours after publishing for data to start appearing in Google Analytics. You can check Reports → Realtime overview to confirm events are being received as they happen.
Publish in the upper right corner to share or embed your app.Common use cases
With a Google Analytics connection, you can create apps like:- Marketing & Landing Pages: Track traffic, conversions, and campaign performance
- Onboarding & Memberships: Understand where users drop off and how they complete key flows
- E-commerce Apps: Measure purchases, checkout funnels, and revenue performance
- Lead Generation Apps: Analyze form submissions, CTA clicks, and conversion rates
- Content Platforms: Track page views, interactions, and content performance